United States congressional apportionment
United States congressional apportionment is the process by which seats in the United States House of Representatives are redistributed amongst the 50 states following each constitutionally mandated decennial census. Each state is apportioned a number of seats which approximately corresponds to its share of the aggregate population of the 50 states.[1] However, every state is constitutionally guaranteed at least one seat.
Contents |
Reapportionment
The number of seats in the House of Representatives is currently set to 435, and has been since 1913, except for a temporary increase to 437 after the admissions of Alaska and Hawaii. Though the actual reapportionment will normally occur in respect of a decennial census, the law that governs the total number of representatives and the method of apportionment to be carried into force at that time can be created prior to the census.
The decennial apportionment also determines the size of each state's representation in the U.S. Electoral College—that is, any state's number of electors equals the size of its total congressional delegation (i.e., House seat(s) plus Senate seats).[2]
Federal law requires the Clerk of the House of Representatives to notify each state government of its entitled number of seats no later than January 25 of the year immediately following the census. After seats have been reapportioned, each state determines the boundaries of congressional districts—geographical areas within the state of approximately equal population—in a process called redistricting.[3] Any citizen of the State can challenge the constitutionality of the redistricting in their US Distrct court, Title 28 United States Code, Section 2284 (a).
Because the deadline to report the results does not occur until the following January, the decennial census does not affect the elections that are held during that same year. For example, the electoral college apportionment during 2000 presidential election was still based on the 1990 census results.
Constitutional text
The subject of representation is addressed twice in the U.S. Constitution. Originally, the apportionment of House seats was commanded by Article I, Section 2, clause 3, which states:
Representatives and direct Taxes shall be apportioned among the several States which may be included within this Union, according to their respective Numbers, which shall be determined by adding to the whole Number of free Persons, including those bound to Service for a Term of Years, and excluding Indians not taxed, three fifths of all other Persons.[4]
Following the end of the Civil War, the above provision was superseded by Section 2 of the Fourteenth Amendment, which states:
Representatives shall be apportioned among the several States according to their respective numbers, counting the whole number of persons in each State, excluding Indians not taxed.[5]
Article I additionally provides that:
The Number of Representatives shall not exceed one for every thirty Thousand, but each State shall have at Least one Representative...[4]
House size
| Years | Source | Constituents per Rep. |
|---|---|---|
| 1789–1793 | U.S. Const. | 30,000 |
| 1793–1803 | 1790 Census | 33,000 |
| 1803–1813 | 1800 Census | 33,000 |
| 1813–1823 | 1810 Census | 35,000 |
| 1823–1833 | 1820 Census | 40,000 |
| 1833–1843 | 1830 Census | 47,700 |
| 1843–1853 | 1840 Census | 70,680 |
| 1853–1863 | 1850 Census | 93,425 |
| 1863–1873 | 1860 Census | 127,381 |
| 1873–1883 | 1870 Census | 131,425 |
| 1883–1893 | 1880 Census | 151,912 |
| 1893–1903 | 1890 Census | 173,901 |
| 1903–1913 | 1900 Census | 194,182 |
| 1913–1923 | 1910 Census | 212,407 |
The size of the U.S. House of Representatives refers to total number of congressional districts (or seats) into which the land area of the United States proper has been divided. The number of voting representatives is currently set at 435. There are an additional five delegates to the House of Representatives. They represent the District of Columbia and the territories of American Samoa, Guam, the Northern Mariana Islands, which first elected a representative in 2008,[6] and the U.S. Virgin Islands. Puerto Rico also elects a resident commissioner every four years.
Controversy and history
During the period that the current U.S. Constitution has been in effect, the number of citizens per congressional district has risen from an average of 33,000 in 1790 to almost 700,000 as of 2008[update]. Prior to the 20th century, the number of representatives increased every decade as more states joined the union, and the population increased. In 1911, Public Law 62-5 raised the membership of the U.S. House to 433 with a provision to add one permanent seat each upon the admissions of Arizona and New Mexico as states. As provided, membership increased to 435 in 1912.
But in 1921, Congress failed to reapportion the House membership as required by the United States Constitution. This failure to reapportion may have been politically motivated, as the newly elected Republican majority may have feared the effect such a reapportionment would have on their future electoral prospects [7] [8]. Then in 1929 Congress (Republican control of both houses of congress and the presidency) passed the Reapportionment Act of 1929 which capped the size of the House at 435 (the then current number), but allowed temporary increases upon the admission of new states which were to be reverted upon the implementation of the immediate subsequent census.
In truth, the rules prohibiting legislative entrenchment would allow any subsequent legislature (after 1929) to increase or decrease the membership of the House of Representatives if such legislature so desired.
The current size of 435 seats means one member represents on average about 709,760[9] people; but exact representation per member varies by state. Three states – Wyoming, Vermont, and North Dakota – have populations smaller than the average for a single district.
The "ideal" number of members has been a contentious issue since the country's founding. George Washington agreed that the original representation proposed during the Constitutional Convention (one representative for every 40,000) was inadequate and supported an alteration to reduce that number to 30,000.[10] This was the only time that Washington pronounced an opinion on any of the actual issues debated during the entire convention.
In Federalist No. 55, James Madison addressed Anti-Federalist claims that the representation would be inadequate. Madison countered that the major inadequacies are of minimal inconvenience since these will be cured rather quickly by virtue of decennial reapportionment. He noted, however,
"I take for granted here what I shall, in answering the fourth objection, hereinafter show, that the number of representatives will be augmented from time to time in the manner provided by the Constitution. On a contrary supposition, I should admit the objection to have very great weight indeed."
Madison also argued against the assumption that more is better,
"Sixty or seventy men may be more properly trusted with a given degree of power than six or seven. But it does not follow that six or seven hundred would be proportionably a better depositary. And if we carry on the supposition to six or seven thousand, the whole reasoning ought to be reversed. ... In all very numerous assemblies, of whatever character composed, passion never fails to wrest the sceptre from reason."[11]
The first proposed amendment to the Constitution within the Bill of Rights attempted to set a pattern for growth of the House along with the population, but was never ratified.
Clemons v. Department of Commerce
A recent lawsuit, Clemons v. Department of Commerce, sought a court order for Congress to increase the size of the House's voting membership and then reapportion the seats in accordance with the population figures of the 2010 Census. The intent of the plaintiff was to rectify the disparity of congressional district population sizes among the states that result from the present method of apportionment. Upon reaching the U.S. Supreme Court in December 2010, the holdings of the lower district and appellate courts were vacated and the case remanded to the U.S. District Court from which the case originated with instructions that the district court dismiss the case for lack of jurisdiction.
Proposed expansion
The proposed Wyoming Rule calls for expanding the House until the standard Representative-to-population ratio equals that of the smallest entitled unit (currently the state of Wyoming). This proposal is primarily designed to address the fact that some House districts are currently nearly twice the size of others; for instance, there are about 944,000 residents in Montana's single district, compared to about 515,000 in Wyoming's. See List of U.S. states by population.
On May 21, 2001, Rep. Alcee Hastings sent a dear colleague letter pointing out that U.S. expansion of its legislature had not kept pace with other countries.[12]
In 2007, during the 110th Congress, Representative Tom Davis introduced a bill in the House of Representatives that would add two seats to the House, one for Utah and one for the District of Columbia. It was passed by the House, but was tripped up by procedural hurdles in Senate and withdrawn from consideration. An identical bill was reintroduced during the 111th Congress. In February 2009 the Senate adopted the measure 61-37. In April 2010, however, House leaders decided to shelve the proposal.[13]
Apportionment methods
Apart from the requirement that the number of delegates for each state is at least one, a state's number of representatives is in principle proportional to population, thus assuring reasonably consistent representation to the people regardless of the state boundaries and populations. No method of calculating a fair distribution of voting power across the various states was known until recently and five distinct apportionment methods have been used since the adoption of the Constitution, none of them producing fully proportional distribution of power among the states. Some of these methods were even susceptible to the apportionment paradox. In 2008, however, a so-called One-Person-One-Vote model was introduced by J. Toplak in Temple Law Review,[14] which distributes the states' power in the House of Representatives exactly 'according to their Numbers'. Under this system, however, members of the House of Representatives do not have equal voting power. The method would be constitutional since the U.S. Constitution does not require Congressmen to have equal voting powers but does require the voters to have votes of equal weight.
The Method of Equal Proportions
The apportionment methodology currently used is the method of equal proportions,[15][16][17] so called because it guarantees that no additional transfer of a seat (from one state to another) will reduce the ratio between the numbers of persons per representative in any two states.[18] According to NationalAtlas.gov, the method of equal proportions minimizes the percentage differences in the size of the congressional districts.[19]
In this method, as a first step, each of the 50 states is given its one guaranteed seat in the House of Representatives, leaving 385 seats to assign.
The remaining seats are allocated one at a time, to the state with the highest priority number. Thus, the 51st seat would go to the most populous state (currently California). The priority number is determined by a formula that is mathematically computed to be the ratio of the state population to the geometric mean of the number of seats it currently holds in the assignment process, n (initially 1), and the number of seats it would hold if the seat were assigned to it, n+1.
The formula for determining the priority of a state to be apportioned the next available seat defined by the method of equal proportions is
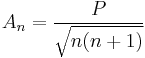
where P is the population of the state, and n is the number of seats it currently holds before the possible allocation of the next seat. An equivalent, recursive definition is
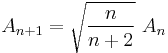
where n is still the number of seats the state has before allocation of the next, and for n = 1, the initial A1 is explicitly defined as

Consider the reapportionment following the 2000 U.S. Census: beginning with all states initially being allocated one seat, the largest value of A1 corresponds to the largest state, California, which is allocated seat 51. After being allocated its 2nd seat, its priority value decreases to its A2 value, which is reordered to a position back in line. The 52nd seat goes to Texas, the 2nd largest state, because its A1 priority value is larger than the An of any other state. However, the 53rd seat goes back to California because its A2 priority value is larger than the An of any other state. The 54th seat goes to New York because its A1 priority value is larger than the An of any other state at this point. This process continues until all remaining seats are assigned. Each time a state is assigned a seat, n is incremented by 1, causing its priority value to be reduced and reordered among the states, whereupon another state normally rises to the top of the list.
The Census 2010 Ranking of Priority Values[20] shows the order in which seats 51–435 were apportioned after the 2010 Census, with additional listings for the next five priorities. Minnesota was allocated the final (435th) seat. North Carolina, which gained the 435th seat in the 2000 census,[21] missed its 14th seat by 15,754 residents as the 436th seat to be allocated.
Past apportionments
Note: The first apportionment was established by the Constitution based on population estimates made by the Philadelphia Convention, and was not based on any census or enumeration.
| Census, Year | Effected | Size | AL | AK | AZ | AR | CA | CO | CT | DE | FL | GA | HI | ID | IL | IN | IA | KS | KY | LA | ME | MD | MA | MI | MN | MS | MO | MT | NE | NV | NH | NJ | NM | NY | NC | ND | OH | OK | OR | PA | RI | SC | SD | TN | TX | UT | VT | VA | WA | WV | WI | WY | ||||||||||
|---|---|---|---|---|---|---|---|---|---|---|---|---|---|---|---|---|---|---|---|---|---|---|---|---|---|---|---|---|---|---|---|---|---|---|---|---|---|---|---|---|---|---|---|---|---|---|---|---|---|---|---|---|---|---|---|---|---|---|---|---|---|---|
| Const. | 1789 | 65 | – | – | – | – | – | – | 5 | 1 | – | 3 | – | – | – | – | – | – | – | – | – | 6 | 8 | – | – | – | – | – | – | – | 3 | 4 | – | 6 | 5 | – | – | – | – | 8 | 1 | 5 | – | – | – | – | – | 10 | – | – | – | – | ||||||||||
| 1st, 1790 | 1793 | 105 | – | – | – | – | – | – | 7 | 1 | – | 2 | – | – | – | – | – | – | 2 | – | – | 8 | 14 | – | – | – | – | – | – | – | 4 | 5 | – | 10 | 10 | – | – | – | – | 13 | 2 | 6 | – | – | – | – | 2 | 19 | – | – | – | – | ||||||||||
| 2nd, 1800 | 1803 | 142 | – | – | – | – | – | – | 7 | 1 | – | 4 | – | – | – | – | – | – | 6 | – | – | 9 | 17 | – | – | – | – | – | – | – | 5 | 6 | – | 17 | 12 | – | 1 | – | – | 18 | 2 | 8 | – | 3 | – | – | 4 | 22 | – | – | – | – | ||||||||||
| 3rd, 1810 | 1813 | 182 | – | – | – | – | – | – | 7 | 2 | – | 6 | – | – | – | – | – | – | 10 | 1 | – | 9 | 20 | – | – | – | – | – | – | – | 6 | 6 | – | 27 | 13 | – | 6 | – | – | 23 | 2 | 9 | – | 6 | – | – | 6 | 23 | – | – | – | – | ||||||||||
| 4th, 1820 | 1823 | 213 | 3 | – | – | – | – | – | 6 | 1 | – | 7 | – | – | 1 | 3 | – | – | 12 | 3 | 7 | 9 | 13 | – | – | 1 | 1 | – | – | – | 6 | 6 | – | 34 | 13 | – | 14 | – | – | 26 | 2 | 9 | – | 9 | – | – | 5 | 22 | – | – | – | – | ||||||||||
| 5th, 1830 | 1833 | 240 | 5 | – | – | – | – | – | 6 | 1 | – | 9 | – | – | 3 | 7 | – | – | 13 | 3 | 8 | 8 | 12 | – | – | 2 | 2 | – | – | – | 5 | 6 | – | 40 | 13 | – | 19 | – | – | 28 | 2 | 9 | – | 13 | – | – | 5 | 21 | – | – | – | – | ||||||||||
| 6th, 1840 | 1843 | 223 | 7 | – | – | 1 | – | – | 4 | 1 | – | 8 | – | – | 7 | 10 | – | – | 10 | 4 | 7 | 6 | 10 | 3 | – | 4 | 5 | – | – | – | 4 | 5 | – | 34 | 9 | – | 21 | – | – | 24 | 2 | 7 | – | 11 | – | – | 4 | 15 | – | – | – | – | ||||||||||
| 7th, 1850 | 1853 | 234 | 7 | – | – | 2 | 2 | – | 4 | 1 | 1 | 8 | – | – | 9 | 11 | 2 | – | 10 | 4 | 6 | 6 | 11 | 4 | – | 5 | 7 | – | – | – | 3 | 5 | – | 33 | 8 | – | 21 | – | – | 25 | 2 | 6 | – | 10 | 2 | – | 3 | 13 | – | – | 3 | – | ||||||||||
| 8th, 1860 | 1863 | 241 | 6 | – | – | 3 | 3 | – | 4 | 1 | 1 | 7 | – | – | 14 | 11 | 6 | 1 | 9 | 5 | 5 | 5 | 10 | 6 | 2 | 5 | 9 | – | – | – | 3 | 5 | – | 31 | 7 | – | 19 | – | 1 | 24 | 2 | 4 | – | 8 | 4 | – | 3 | 11 | – | – | 6 | – | ||||||||||
| 9th, 1870 | 1873 | 292 | 8 | – | – | 4 | 4 | – | 4 | 1 | 2 | 9 | – | – | 19 | 13 | 9 | 3 | 10 | 6 | 5 | 6 | 11 | 9 | 3 | 6 | 13 | – | 1 | 1 | 3 | 7 | – | 33 | 8 | – | 20 | – | 1 | 27 | 2 | 5 | – | 10 | 6 | – | 3 | 9 | – | 3 | 8 | – | ||||||||||
| 10th, 1880 | 1883 | 325 | 8 | – | – | 5 | 6 | 1 | 4 | 1 | 2 | 10 | – | – | 20 | 13 | 11 | 7 | 11 | 6 | 4 | 6 | 12 | 11 | 5 | 7 | 14 | – | 3 | 1 | 2 | 7 | – | 34 | 9 | – | 21 | – | 1 | 28 | 2 | 7 | – | 10 | 11 | – | 2 | 10 | – | 4 | 9 | – | ||||||||||
| 11th, 1890 | 1893 | 356 | 9 | – | – | 6 | 7 | 2 | 4 | 1 | 2 | 11 | – | 1 | 22 | 13 | 11 | 8 | 11 | 6 | 4 | 6 | 13 | 12 | 7 | 7 | 15 | 1 | 6 | 1 | 2 | 8 | – | 34 | 9 | 1 | 21 | – | 2 | 30 | 2 | 7 | 2 | 10 | 13 | – | 2 | 10 | 2 | 4 | 10 | 1 | ||||||||||
| Census | Effected | Size | AL | AK | AZ | AR | CA | CO | CT | DE | FL | GA | HI | ID | IL | IN | IA | KS | KY | LA | ME | MD | MA | MI | MN | MS | MO | MT | NE | NV | NH | NJ | NM | NY | NC | ND | OH | OK | OR | PA | RI | SC | SD | TN | TX | UT | VT | VA | WA | WV | WI | WY | ||||||||||
| 12th, 1900 | 1903 | 386 | 9 | – | – | 7 | 8 | 3 | 5 | 1 | 3 | 11 | – | 1 | 25 | 13 | 11 | 8 | 11 | 7 | 4 | 6 | 14 | 12 | 9 | 8 | 16 | 1 | 6 | 1 | 2 | 10 | – | 37 | 10 | 2 | 21 | – | 2 | 32 | 2 | 7 | 2 | 10 | 16 | 1 | 2 | 10 | 3 | 5 | 11 | 1 | ||||||||||
| 13th, 1910 | 1913 | 435 | 10 | – | 1 | 7 | 11 | 4 | 5 | 1 | 4 | 12 | – | 2 | 27 | 13 | 11 | 8 | 11 | 8 | 4 | 6 | 16 | 13 | 10 | 8 | 16 | 2 | 6 | 1 | 2 | 12 | 1 | 43 | 10 | 3 | 22 | 8 | 3 | 36 | 3 | 7 | 3 | 10 | 18 | 2 | 2 | 10 | 5 | 6 | 11 | 1 | ||||||||||
| 14th, 1920 | Congress failed to pass any reapportionment act. Distribution of seats from 1913 remained in effect, despite population shifts. | |||||||||||||||||||||||||||||||||||||||||||||||||||||||||||||
| 15th, 1930 | 1933 | 435 | 9 | – | 1 | 7 | 20 | 4 | 6 | 1 | 5 | 10 | – | 2 | 27 | 12 | 9 | 7 | 9 | 8 | 3 | 6 | 15 | 17 | 9 | 7 | 13 | 2 | 5 | 1 | 2 | 14 | 1 | 45 | 11 | 2 | 24 | 9 | 3 | 34 | 2 | 6 | 2 | 9 | 21 | 2 | 1 | 9 | 6 | 6 | 10 | 1 | ||||||||||
| 16th, 1940 | 1943 | 435 | 9 | – | 2 | 7 | 23 | 4 | 6 | 1 | 6 | 10 | – | 2 | 26 | 11 | 8 | 6 | 9 | 8 | 3 | 6 | 14 | 17 | 9 | 7 | 13 | 2 | 4 | 1 | 2 | 14 | 2 | 45 | 12 | 2 | 23 | 8 | 4 | 33 | 2 | 6 | 2 | 10 | 21 | 2 | 1 | 9 | 6 | 6 | 10 | 1 | ||||||||||
| 17th, 1950 | 1953 | 435 | 9 | – | 2 | 6 | 30 | 4 | 6 | 1 | 8 | 10 | – | 2 | 25 | 11 | 8 | 6 | 8 | 8 | 3 | 7 | 14 | 18 | 9 | 6 | 11 | 2 | 4 | 1 | 2 | 14 | 2 | 43 | 12 | 2 | 23 | 6 | 4 | 30 | 2 | 6 | 2 | 9 | 22 | 2 | 1 | 10 | 7 | 6 | 10 | 1 | ||||||||||
| 18th, 1960 | 1963 | 435 | 8 | 1 | 3 | 4 | 38 | 4 | 6 | 1 | 12 | 10 | 2 | 2 | 24 | 11 | 7 | 5 | 7 | 8 | 2 | 8 | 12 | 19 | 8 | 5 | 10 | 2 | 3 | 1 | 2 | 15 | 2 | 41 | 11 | 2 | 24 | 6 | 4 | 27 | 2 | 6 | 2 | 9 | 23 | 2 | 1 | 10 | 7 | 5 | 10 | 1 | ||||||||||
| 19th, 1970 | 1973 | 435 | 7 | 1 | 4 | 4 | 43 | 5 | 6 | 1 | 15 | 10 | 2 | 2 | 24 | 11 | 6 | 5 | 7 | 8 | 2 | 8 | 12 | 19 | 8 | 5 | 10 | 2 | 3 | 1 | 2 | 15 | 2 | 39 | 11 | 1 | 23 | 6 | 4 | 25 | 2 | 6 | 2 | 8 | 24 | 2 | 1 | 10 | 7 | 4 | 9 | 1 | ||||||||||
| 20th, 1980 | 1983 | 435 | 7 | 1 | 5 | 4 | 45 | 6 | 6 | 1 | 19 | 10 | 2 | 2 | 22 | 10 | 6 | 5 | 7 | 8 | 2 | 8 | 11 | 18 | 8 | 5 | 9 | 2 | 3 | 2 | 2 | 14 | 3 | 34 | 11 | 1 | 21 | 6 | 5 | 23 | 2 | 6 | 1 | 9 | 27 | 3 | 1 | 10 | 8 | 4 | 9 | 1 | ||||||||||
| 21st, 1990 | 1993 | 435 | 7 | 1 | 6 | 4 | 52 | 6 | 6 | 1 | 23 | 11 | 2 | 2 | 20 | 10 | 5 | 4 | 6 | 7 | 2 | 8 | 10 | 16 | 8 | 5 | 9 | 1 | 3 | 2 | 2 | 13 | 3 | 31 | 12 | 1 | 19 | 6 | 5 | 21 | 2 | 6 | 1 | 9 | 30 | 3 | 1 | 11 | 9 | 3 | 9 | 1 | ||||||||||
| 22nd, 2000 | 2003 | 435 | 7 | 1 | 8 | 4 | 53 | 7 | 5 | 1 | 25 | 13 | 2 | 2 | 19 | 9 | 5 | 4 | 6 | 7 | 2 | 8 | 10 | 15 | 8 | 4 | 9 | 1 | 3 | 3 | 2 | 13 | 3 | 29 | 13 | 1 | 18 | 5 | 5 | 19 | 2 | 6 | 1 | 9 | 32 | 3 | 1 | 11 | 9 | 3 | 8 | 1 | ||||||||||
| 23rd, 2010 | 2013 | 435 | 7 | 1 | 9 | 4 | 53 | 7 | 5 | 1 | 27 | 14 | 2 | 2 | 18 | 9 | 4 | 4 | 6 | 6 | 2 | 8 | 9 | 14 | 8 | 4 | 8 | 1 | 3 | 4 | 2 | 12 | 3 | 27 | 13 | 1 | 16 | 5 | 5 | 18 | 2 | 7 | 1 | 9 | 36 | 4 | 1 | 11 | 10 | 3 | 8 | 1 | ||||||||||
| Census, Year | Effected | Size | AL | AK | AZ | AR | CA | CO | CT | DE | FL | GA | HI | ID | IL | IN | IA | KS | KY | LA | ME | MD | MA | MI | MN | MS | MO | MT | NE | NV | NH | NJ | NM | NY | NC | ND | OH | OK | OR | PA | RI | SC | SD | TN | TX | UT | VT | VA | WA | WV | WI | WY | ||||||||||
Changes following the 2010 census
On December 21, 2010 the U.S. Census Bureau released its official apportionment results for congressional representation. The changes will be in effect for the U.S. elections in 2012, provided no legal challenges to the results significantly change the results.[22]
| Gain four | Gain two | Gain one | Lose one | Lose two |
|---|---|---|---|---|
| Texas | Florida | Arizona Georgia Nevada South Carolina Utah Washington |
Illinois Iowa Louisiana Massachusetts Michigan Missouri New Jersey Pennsylvania |
New York Ohio |
Past increases
The size of the U.S. House has increased as follows:[23]
1789–1800
| Date | Size | ∆ | Citation | Comments |
|---|---|---|---|---|
| March 4, 1789 | 59 | n/a | Const. Art. I, § 2, cl. 3 |
Seats apportioned by the Constitution |
| November 21, 1789 | 64 | +5 | North Carolina ratified the Constitution with the seats apportioned by the Constitution | |
| May 29, 1790 | 65 | +1 | Rhode Island ratified the Constitution with the seats apportioned by the Constitution | |
| March 4, 1791 | 67 | +2 | 1 Stat. 191 | Vermont admitted |
| June 1, 1792 | 69 | +2 | Kentucky admitted | |
| March 4, 1793 | 105 | +36 | 1 Stat. 253 | Apportionment of the First Census |
| June 1, 1796 | 106 | +1 | 1 Stat. 492 | Tennessee admitted |
1801–1820
| Date | Size | ∆ | Citation | Comments |
|---|---|---|---|---|
| March 1, 1803 | 107 | +1 | 2 Stat. 175 | Ohio admitted. |
| March 4, 1803 | 142 | +35 | 2 Stat. 128 | Apportionment of the Second Census. |
| April 30, 1812 | 143 | +1 | 2 Stat. 703 | Louisiana admitted. |
| March 4, 1813 | 182 | +39 | 2 Stat. 669 | Apportionment of the Third Census. |
| December 11, 1816 | 183 | +1 | 3 Stat. 290 | Indiana admitted. |
| December 10, 1817 | 184 | +1 | 3 Stat. 349 | Mississippi admitted. |
| December 3, 1818 | 185 | +1 | 3 Stat. 430 | Illinois admitted. |
| December 14, 1819 | 186 | +1 | 3 Stat. 492 | Alabama admitted. |
| March 15, 1820 | n/c | 3 Stat. 555 | Maine admitted, given seven seats. Massachusetts delegation reduced correspondingly |
1821–1840
| Date | Size | ∆ | Citation | Comments |
|---|---|---|---|---|
| August 10, 1821 | 187 | +1 | 3 Stat. 545 | Missouri admitted |
| March 4, 1823 | 213 | +26 | 3 Stat. 651 | Apportionment of the Fourth Census |
| March 4, 1833 | 240 | +27 | 4 Stat. 516 | Apportionment of the Fifth Census |
| June 15, 1836 | 241 | +1 | 5 Stat. 49 | Arkansas admitted |
| January 26, 1837 | 242 | +1 | 5 Stat. 50 | Michigan admitted |
1841–1860
| Date | Size | ∆ | Citation | Comments |
|---|---|---|---|---|
| March 4, 1843 | 223 | −19 | 5 Stat. 491 | Apportionment of the Sixth Census, the only time the size of the House was reduced, except for the minor readjustment in 1963. |
| March 3, 1845 | 224 | +1 | 5 Stat. 743 | Florida admitted. |
| December 29, 1845 | 226 | +2 | 5 Stat. 798 | Texas annexed and admitted. |
| December 28, 1846 | 228 | +2 | 5 Stat. 743 | Iowa admitted. |
| May 29, 1848 | 230 | +2 | 9 Stat. 235 | Wisconsin admitted. |
| March 4, 1849 | 231 | +1 | 9 Stat. 235 | Wisconsin given another seat. |
| September 9, 1850 | 233 | +2 | 9 Stat. 452 10 Stat. 25 |
California admitted. |
| March 4, 1853 | 234 | +1 | 9 Stat. 432 | Apportionment of the Seventh Census. |
| May 11, 1858 | 236 | +2 | 11 Stat. 166 | Minnesota admitted. |
| February 14, 1859 | 237 | +1 | 11 Stat. 383 | Oregon admitted. |
1861–1880
| Date | Size | ∆ | Citation | Comments |
|---|---|---|---|---|
| January 29, 1861 | 238 | +1 | 11 Stat. 269 | Kansas admitted |
| June 2, 1862 | 239 | +1 | 12 Stat. 411 | California apportioned an extra seat |
| March 4, 1863 | 241 | +2 | 12 Stat. 353 | Apportionment of the Eighth Census |
| June 20, 1863 | n/c | 12 Stat. 633 | West Virginia admitted and given three seats. Virginia's delegation reduced in census reapportionment | |
| October 31, 1864 | 242 | +1 | 13 Stat. 32 | Nevada admitted |
| March 1, 1867 | 243 | +1 | 14 Stat. 391 | Nebraska admitted |
| March 4, 1873 | 283 | +40 | 17 Stat. 28 | Apportionment of the Ninth Census |
| 292 | +9 | 17 Stat. 192 | Supplemental apportionment added one seat each for nine states | |
| August 1, 1876 | 293 | +1 | 13 Stat. 34 | Colorado admitted |
1881–1900
| Date | Size | ∆ | Citation | Comments |
|---|---|---|---|---|
| March 4, 1883 | 325 | +32 | Apportionment of the Tenth Census. | |
| November 2, 1889 | 328 | +3 | North Dakota and South Dakota admitted. One seat goes to the former, two to the latter. | |
| November 8, 1889 | 329 | +1 | Montana admitted. | |
| November 11, 1889 | 330 | +1 | Washington admitted. | |
| July 3, 1890 | 331 | +1 | Idaho admitted. | |
| July 10, 1890 | 332 | +1 | Wyoming admitted. | |
| March 4, 1893 | 356 | +24 | Apportionment of the Eleventh Census. | |
| January 4, 1896 | 357 | +1 | Utah admitted. |
1901–present
| Date | Size | ∆ | Citation | Comments |
|---|---|---|---|---|
| March 4, 1903 | 386 | +29 | Apportionment of the Twelfth Census | |
| November 16, 1907 | 391 | +5 | Oklahoma admitted | |
| January 6, 1912 | 392 | +1 | New Mexico admitted | |
| February 14, 1912 | 393 | +1 | Arizona admitted | |
| March 4, 1913 | 435 | +42 | Public Law 62-5 | Apportionment of the Thirteenth Census |
| January 3, 1959 | 436 | +1 | Alaska admitted | |
| August 21, 1959 | 437 | +1 | Hawaii admitted | |
| January 3, 1963 | 435 | −2 | Reapportionment Act of 1929 | Apportionment of the Eighteenth Census |
See also
- Apportionment paradox
- Article the First
- Gerrymandering
- List of U.S. states by population
- List of U.S. states by historical population (tables of state populations since 1790)
- Redistricting
- United States Congress
Notes
- Delegate counts in italics represent temporary counts assigned by Congress until the next decennial census or by the U.S. Constitution in 1789 until the first U.S. Census.
- Elections held in the year of a census use the apportionment determined by the previous census.
- ^ The populations of Washington, D.C. and federal territories are not included in this figure.
- ^ U.S. Constitution, Article II, Section 1, Clause 2.
- ^ 2 U.S.C. § 2c
- ^ a b U.S. Const., art. I, § 2, cl. 3.
- ^ U.S. Const., amend. XIV, § 2.
- ^ Bush signs federalization bill, Agnes E. Donato, Saipan Tribune, May 10, 2008.
- ^ "Fair Representation, Meeting The Ideal of One Man One vote" - Michael Balinski and H. Peyton Young -- Page 51
- ^ [1]
- ^ http://www.thirty-thousand.org/
- ^ George Will Called Me An Idiot, Jonah Golderg, National Review, January 15, 2001.
- ^ The Federalist #55
- ^ House of Representatives? Hardly., Alcee Hastings, May 21, 2001.
- ^ Marimow, Ann E.; Pershing, Ben (April 21, 2010). "Congressional leaders shelve D.C. voting rights bill". The Washington Post. http://www.washingtonpost.com/wp-dyn/content/article/2010/04/20/AR2010042004796.html.
- ^ "Toplak, Jurij, Equal Voting Weight of All: Finally 'One Person, One Vote' from Hawaii to Maine?". Temple Law Review, Vol. 81, 2009, p. 123-176. http://www.temple.edu/law/tlawrev/content/issues/81.1/81.1_toplak.pdf.
- ^ "The History of Apportionment in America". American Mathematical Society. http://www.ams.org/featurecolumn/archive/apportion2.html. Retrieved 2009-02-15.
- ^ "2 USC §2a". Cornell University Law School, Legal Information Institute. http://www.law.cornell.edu/uscode/html/uscode02/usc_sec_02_00000002---a000-.html. Retrieved 2008-05-13.
- ^ "Computing Apportionment". U.S. Census Bureau. http://www.census.gov/population/www/censusdata/apportionment/computing.html. Retrieved 2009-02-14.
- ^ Edward V Huntington (1921). "The Mathematical Theory of the Apportionment of Representatives". Proceedings of the National Academy of Sciences U.S.A.. PMC 1084767. http://www.pubmedcentral.nih.gov/articlerender.fcgi?tool=pmcentrez&artid=1084767.
- ^ "Congressional Apportionment". NationalAtlas.gov. http://www.nationalatlas.gov/articles/boundaries/a_conApport.html#six. Retrieved 2009-02-14.
- ^ "PRIORITY VALUES FOR 2010 CENSUS". U.S. Bureau of the Census. http://www.census.gov/population/apportionment/data/files/Priority%20Values%202010.pdf. Retrieved 2011-08-17.
- ^ "Census 2000 Ranking of Priority Values". U.S. Bureau of the Census. 2001-02-21. http://www.census.gov/population/censusdata/apportionment/00pvalues.txt. Retrieved 2008-05-13.
- ^ "APPORTIONMENT POPULATION AND NUMBER OF REPRESENTATIVES, BY STATE: 2010 CENSUS". US Census. 2010-12-21. http://2010.census.gov/news/pdf/apport2010_table1.pdf. Retrieved 2010-12-21.
- ^ The Size of the U. S. House of Representatives and its Constituent State Delegations, thirty-thousand.org.
References
- Balinski, Michael L.; Young, H. Peyton (1982). Fair Representation: Meeting the Ideal of One Man, One Vote. New Haven, CT: Yale University Press. ISBN 0-8157-0090-3. http://books.google.com/?id=eBFNzSeAv_sC.
- Foster, Robert (1895). Commentaries on the Constitution of the United States: Historical and Judicial. 1. Boston: The Boston Book Co.. pp. 329–446. http://books.google.com/?id=Rd49AAAAIAAJ.
- Hamilton, Alexander; Madison, James; Jay, John (1831). The Federalist. Hallowell: Glazier, Masters & Co.. ISBN 0-8239-5735-7. http://books.google.com/?id=6TATAAAAYAAJ.
- Edelman, Paul H. (2006). "Getting the Math Right: Why California Has Too Many Seats in the House of Representatives". Vanderbilt Law Review (Nashville: Vanderbilt University) 102 (March): 297.
- Charles Kromkowski and John A Kromkowski; Kromkowski, John A (1991). "Why 435? A Question of Political Arithmetic" (PDF). Polity 24 (Fall 1991): 129–145. doi:10.2307/3234988. JSTOR 3234988. http://www.thirty-thousand.org/documents/Kromkowski_Fall1991.pdf. Retrieved 2009-06-22.
- Agnew, Robert A. (2008). "Optimal Congressional Apportionment". American Mathematical Monthly (Mathematical Association of America) 115 (April): 297–303.
Further reading
- Stinebrickner-Kauffman, Taren (2004). "Counting Matters: Prison Inmates, Population Bases, and "One Person, One Vote"". Virginia Journal of Social Policy & the Law (Chicago: Virginia Journal of Social Policy & the Law) 11 (Winter): 229.